Automotive Industry Growth: Trends and Forecast Drivers
Automotive industry growth in 2026 points to low-to-mid single-digit production expansion, with winners and losers set by China’s scale, EV pricing pressure, and supply-chain reallocation rather than by headline unit growth. Miss those shifts and margins, plant utilization, and sourcing plans will move the wrong way fast. This guide covers 2026 production trends, model competition, regulation, and supply-chain pressure.
How fast is the automotive industry growing in 2026?

Public indicators point to moderate growth in 2026, but not a clean global demand surge. The better lens is production, mix, and competitive position: the industry started from a global market of about $2.75 trillion in 2025, then entered 2026 with uneven regional capacity, pricing pressure, and retooled product plans.
By revenue, the auto industry sits among the largest industrial sectors, so even small shifts in volume or margin matter. But a raw unit forecast misses the bigger story. In 2026, growth will be shaped by where vehicles are built, which powertrains receive investment, and which suppliers can keep pace with changing sourcing rules.
What can and cannot be inferred from public indicators
You can infer direction from capacity additions, factory utilization, model launches, and regulatory deadlines. You cannot infer a precise global growth rate without a formal methodology, especially when regional mix and price competition are moving at the same time.
A common mistake is to treat 2026 automotive growth as if every region, vehicle class, and supplier segment will expand at the same pace. Suppose a supplier wins more EV body-in-white work in China but loses ICE-related content in Europe. Revenue can rise while margin slips. That is growth in output terms, but not necessarily growth in profitability.
📊 The global automotive market was about $2.75 trillion in 2025. Source: Automotive industry.
Why is China shaping automotive growth in 2026?
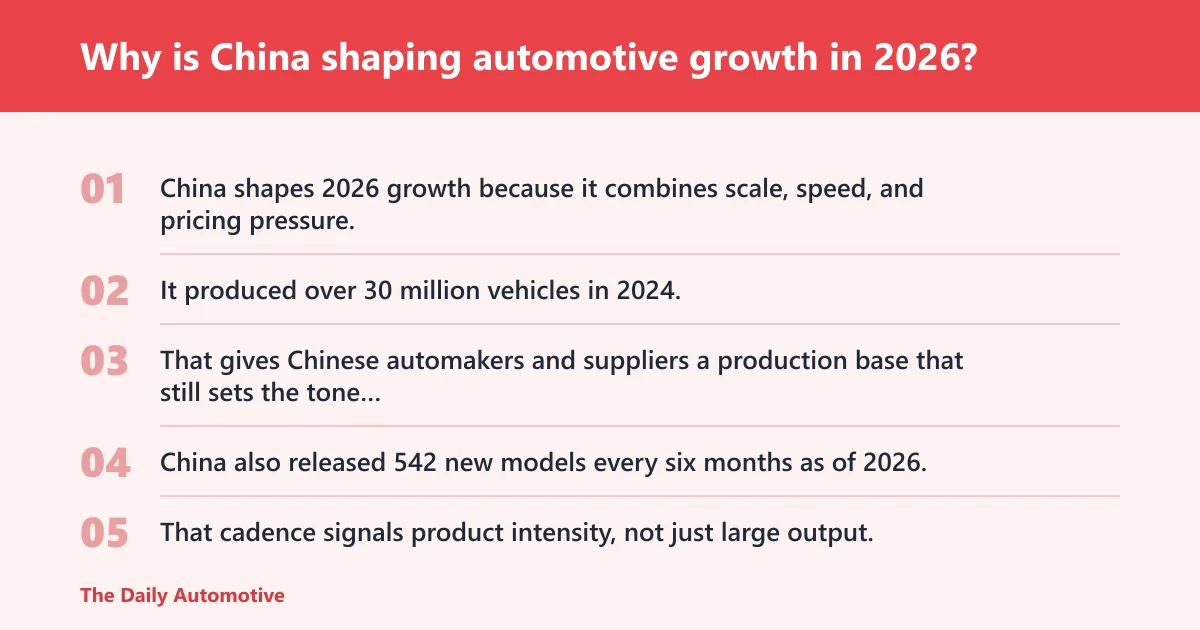
China shapes 2026 growth because it combines scale, speed, and pricing pressure. It produced over 30 million vehicles in 2024, reached that level after being above 30 million in the prior year, and remained the largest vehicle producer in 2024. That gives Chinese automakers and suppliers a production base that still sets the tone for global competition.
China also released 542 new models every six months as of 2026. That cadence signals product intensity, not just large output. It means faster refresh cycles, more segment overlap, and tighter pricing discipline for global rivals trying to defend share in China and abroad.
What rapid model launches say about price pressure and innovation pace
When launch cadence is that high, the market rewards quick engineering, short platform cycles, and efficient software integration. It also raises the bar for styling, driver assistance features, and battery packaging. Competitors that move slowly face an inventory problem before they face a demand problem.
Think of it as a constant comparison test. Every six months, 542 new models create more choices for buyers and more substitutions for fleet buyers, dealers, and importers. That volume of releases puts pressure on prices and compresses the window in which any single model can hold attention.
How China’s capacity affects exports and global pricing
High domestic capacity matters beyond local sales. It gives Chinese manufacturers room to redirect vehicles into export channels when home-market competition tightens. That can push global pricing lower, especially in compact cars, crossovers, and EVs where product overlap is already high.
For suppliers, this can change sourcing patterns fast. A component maker that once served a stable domestic program may find itself competing for export-oriented platforms with tighter cost targets and shorter lead times. That is why China’s output scale affects margins far outside China.

What role do electric vehicles play in 2026 growth?
Electric vehicles are the main competitive battleground in Europe in 2026. They shape product strategy, factory investment, battery sourcing, and pricing. For legacy automakers, EV growth can add volume, but it also brings transition costs, lower near-term margin, and heavier capital spending just to stay in the game.
The EU planned a phase-out of new fossil-fuel vehicles by 2035, so the transition clock keeps ticking. European automakers must spend on platforms, software, batteries, and compliance while Chinese rivals use scale and faster launch cycles to pressure prices. That combination makes EV growth a profitability test as much as a volume opportunity. (en.wikipedia.org)
Why transition costs hit legacy automakers
Legacy firms carry the cost of two systems at once. They still support combustion platforms, dealer networks, and service parts, while also funding EV development, battery agreements, and new factory tooling. That overlap tends to raise overhead before it lowers it.
Restructuring measures often follow. Those can include plant rationalization, job cuts, supplier consolidation, or delayed model programs. None of that means EV demand is weak. It means the cost of participating is high, and the firms with the weakest balance sheets feel the strain first.
Why are European automakers under pressure in 2026?
European automakers are under pressure because they face Chinese competition, a costly EV transition, and a regulatory timeline that limits hesitation. The result is a squeeze on pricing and margins. Companies with older product portfolios must defend share while funding new technology and reworking factory footprints.
That pressure is not abstract. It changes vehicle mix, discounting, and capital allocation. If a company cannot sell enough higher-margin models to fund the transition, it has to choose between lower profits now and weaker competitiveness later.
Competition from Chinese manufacturers
Chinese manufacturers are increasing pressure in Europe by offering competitive EVs, faster refresh cycles, and aggressive launch schedules. European incumbents now compete not only on brand and distribution, but also on software quality, battery economics, and cost per unit delivered.
Picture a midsize EV arriving in Germany at a lower sticker price, with similar range and faster delivery. Dealers feel the pressure first. Then the manufacturer faces lower transaction prices, slower inventory turns, and less room to fund next-year updates.
Margins, pricing, and restructuring
When pricing weakens, fixed costs hurt more. European firms with large installed capacity may respond by trimming shifts, closing lines, or moving more work to lower-cost sites. Those moves can protect cash, but they also show that growth is not the same as healthy expansion.
For the market, that means 2026 growth may show up as reallocation rather than broad-based volume gains. Some brands will expand share. Others will protect cash and shrink. That is a very different story from a simple industry-wide demand forecast.
What does the supply chain mean for industry growth?
The automotive supply chain is an interdependent system in which OEMs depend on suppliers for parts, modules, and assembly capacity. Growth depends on who can provide components on time, at the right quality level, and at a cost the assembler can absorb. Break one link and output slows quickly.
Supply-chain reallocation matters in 2026 because firms are shifting sourcing, plant roles, and logistics routes to manage cost, tariffs, battery sourcing, and regional production targets. Even when demand is stable, bottlenecks in semiconductors, castings, harnesses, or batteries can delay launches and hurt margin.
Why sourcing and capacity moves matter
OEMs rarely control every input. They rely on tiered suppliers for a large share of value creation, then depend on assembly plants to integrate those parts into a finished vehicle. If any major supplier is late, the assembly line can lose output for hours or days.
That is why growth may look stronger on paper than on the shop floor. A company can have a healthy order book and still struggle to deliver enough vehicles if supplier capacity, transport, or tooling readiness falls behind schedule.
- Track supplier concentration by part family, not only by nameplate.
- Check whether battery, electronics, and casting capacity sit in the same region as final assembly.
- Watch lead times for launch-critical parts before committing launch volume.
- Stress-test sourcing plans against tariff, logistics, and quality disruptions.
What safety and quality rules matter most in auto manufacturing?
Automotive safety is highly regulated, and production must comply with local and international rules. ISO 26262 is widely treated as a best-practice framework for automotive functional safety. For manufacturers, that means compliance is part of production planning, not a separate legal afterthought.
Automation raises the stakes rather than reducing them. Automotive manufacturing automation dates to the 1960s, and most cars are now mainly assembled by automated machinery. That improves consistency, but software, calibration, traceability, and process control still need tight oversight.
How recalls interrupt output and margin
A recall can be triggered by defects or faulty manufacturing procedures, and it can involve either a batch or the entire production run. That creates direct costs for inspection, transport, repairs, and customer support, plus indirect costs from lost trust and dealer disruption.
Safety problems also slow growth because they interrupt planning. If a quality issue appears in a major component family, the response may require stop-ship actions, line slowdowns, or supplier audits. The production loss can be larger than the repair bill.
2026 automotive growth scorecard by region
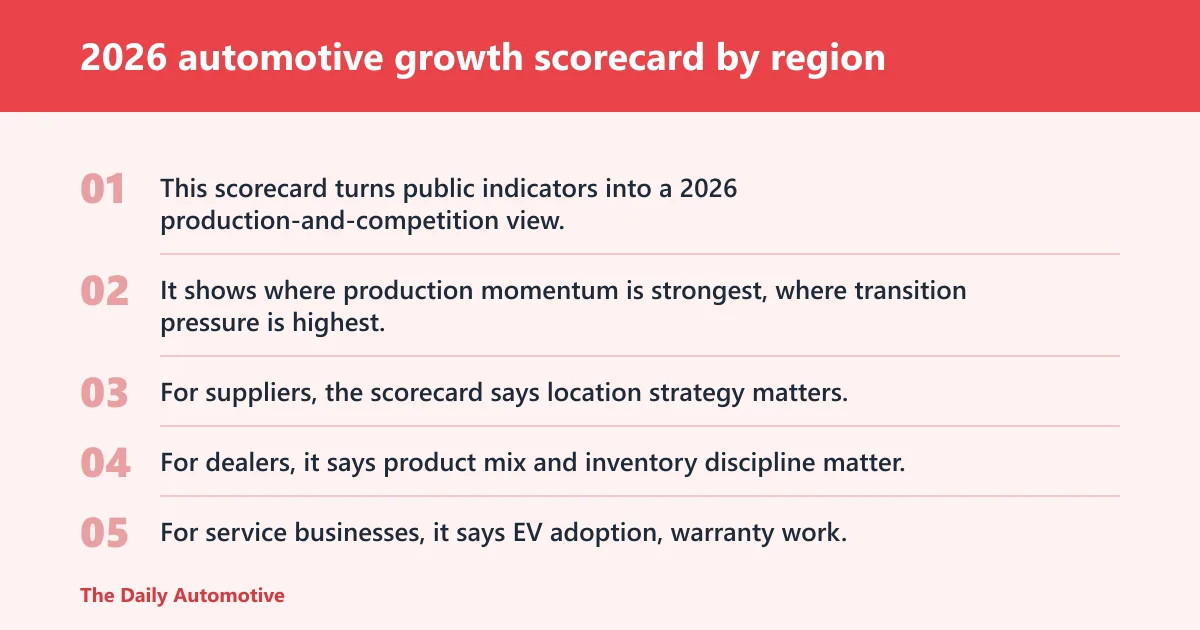
This scorecard turns public indicators into a 2026 production-and-competition view. It is not a demand forecast. It shows where production momentum is strongest, where transition pressure is highest, and where regulatory or competitive risk is most likely to shape margins and capacity choices.
| Region | Production momentum | EV transition pressure | Regulatory risk | Competitive implication |
|---|---|---|---|---|
| China | Very strong; more than 31 million vehicles in 2024 and 542 new models every six months as of 2026 | High, but supported by scale and fast model cadence | Moderate to high, depending on export exposure and policy shifts | Sets pace for pricing, launch frequency, and export pressure |
| Europe | Mixed; capacity remains large but growth is constrained by transition costs | Very high because of the 2035 phase-out of new fossil-fuel vehicles | High, with compliance and investment timing under scrutiny | Legacy automakers face share loss risk and restructuring pressure |
| North America | Moderate; dependent on model launches, truck and SUV mix, and plant utilization | High, but less uniform than Europe | Moderate, with sourcing and trade policy uncertainty | More room for profitable niches, but supply chain moves can shift results fast |
| Japan and Korea | Stable to moderate; export and supplier strength remain important | Moderate to high, especially for global platform refreshes | Moderate, with quality and export compliance central | Advantage depends on efficient platforms, batteries, and export execution |
| Rest of world | Uneven; gains depend on local assembly, import policy, and financing | Low to moderate in many markets, though rising over time | Varies widely by country | Assembly and distribution partners may gain if sourcing shifts toward local capacity |
For suppliers, the scorecard says location strategy matters. For dealers, it says product mix and inventory discipline matter. For service businesses, it says EV adoption, warranty work, and recall volume can shift labor demand even when new-unit growth is only modest.
What are the biggest automotive industry growth trends in 2026?
The biggest trends are China’s scale, Europe’s EV transition pressure, and supply-chain reallocation. Those forces matter more than a single global unit-growth number because they determine who gains pricing power, where capacity is used, and which business models can keep margins intact.
How fast is the global automotive industry growing in 2026?
The safest answer is low-to-mid single-digit production growth, but only as a directional view. The industry’s 2025 baseline was around the mid-$2 trillion range, and 2026 outcomes will depend on region, mix, and pricing rather than one global demand figure that assumes every market is moving the same way.
How many new car models are launching in China?
China released 542 new models every six months as of 2026. That pace matters because it shortens product cycles, intensifies price competition, and forces global rivals to move faster on design, software, and battery economics if they want to defend share.
What safety standards matter in automotive manufacturing?
Automotive safety is highly regulated, and manufacturers must comply with local and international rules. ISO 26262 is a common functional safety framework, especially for electronic and software-driven systems. That matters because defects can trigger recalls, stop-ship actions, and plant disruption.
How does the automotive supply chain affect industry growth?
The supply chain sets how much output can actually reach the market. OEMs depend on suppliers for parts and assembly support, so shortages, tariff shifts, or capacity moves can slow growth even when demand is firm. In 2026, supply reallocation is part of the growth story itself.
Products related to this article
Sponsored / affiliate links. As an Amazon Associate I earn from qualifying purchases. I may earn additional commission from eligible campaigns.