How Many Cars Are Made Each Year? 92.5M in 2024 (OICA Data)
About 92.5 million cars and commercial vehicles rolled off assembly lines worldwide in 2024, according to OICA — down 1.1% from 2023’s 93.5 million. China alone built nearly a third of that total, almost three times as many as the second-place United States. This guide breaks down the latest year-by-year production numbers, the top 10 manufacturing countries, and how electric vehicles are reshaping the count.
Global Car Production by Year: 2024’s Real Numbers (OICA Data)
The International Organization of Motor Vehicle Manufacturers (OICA) counted 92,504,338 motor vehicles built worldwide in 2024 — 67.7 million passenger cars and 24.8 million commercial vehicles (pickups, vans, buses, and heavy trucks). That’s down from 93.5 million in 2023, a 1.1% year-over-year decline, though still far above the pandemic-era low.
World Car Production History: Key Years
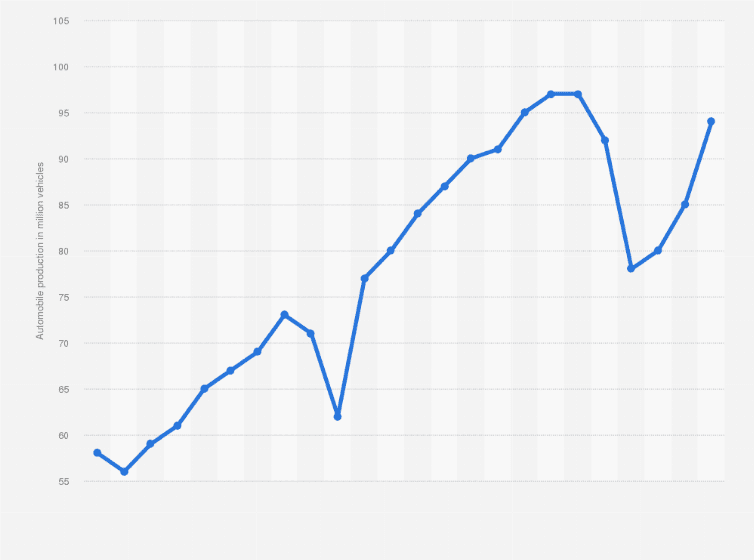
Global production has swung by tens of millions of units over the past 25 years, driven by recessions, the 2008 financial crisis, and the COVID-19 pandemic.
| Year | World Total (units) | What happened |
|---|---|---|
| 1999 | ~47.6 million | Earliest consistent OICA-era data |
| 2007 | ~73 million | Pre-financial-crisis peak |
| 2009 | ~62 million | Global financial crisis dip; China overtakes the U.S. and Japan |
| 2017 | ~97 million | All-time production record |
| 2020 | ~78 million | COVID-19 pandemic — production fell roughly 16% in one year |
| 2023 | 93.5 million | Post-pandemic recovery |
| 2024 | 92,504,338 | -1.1% dip; China’s 16th straight year as the top producer |
📊 92,504,338 motor vehicles were built worldwide in 2024 — down 1.1% from 93.5 million in 2023. Source: OICA, 2024 World Motor Vehicle Production statistics.
At that pace, factories worldwide complete roughly 253,400 vehicles a day — about 10,560 an hour, or one every third of a second. (Daily Automotive calculation: 92,504,338 ÷ 365 days ÷ 24 hours ÷ 60 minutes, based on OICA’s confirmed 2024 total.)
“OICA represent the global auto industry that drives economic progress.”
That total is separate from the running count of cars already on the road — see our guide on how many cars are in the world if you want the cumulative fleet size rather than one year’s output.

Which Countries Produce the Most Cars? (Top 10, 2024)
China built more motor vehicles in 2024 than the next four countries on this list combined. It has held the #1 spot every year since 2009, when it overtook both the United States and Japan. Manufacturing hubs matter here — see our breakdown of where cars are made for how these countries built up their auto industries.
| Rank | Country | 2024 Production | % of World Total |
|---|---|---|---|
| 1 | China | 31,281,592 | 33.8% |
| 2 | United States | 10,562,188 | 11.4% |
| 3 | Japan | 8,234,681 | 8.9% |
| 4 | India | 6,014,691 | 6.5% |
| 5 | Mexico | 4,202,642 | 4.5% |
| 6 | South Korea | 4,127,252 | 4.5% |
| 7 | Germany | 4,069,222 | 4.4% |
| 8 | Brazil | 2,549,595 | 2.8% |
| 9 | Spain | 2,376,504 | 2.6% |
| 10 | Thailand | 1,468,997 | 1.6% |
China’s dominance is concentrated in a handful of provinces — for a closer look at exactly what gets built there, see what cars are produced in China. Together, China, the U.S., and Japan account for 54% of everything built globally each year.
Passenger Cars vs. Commercial Vehicles: What Actually Counts as a “Car”?
“Motor vehicle production” is an umbrella term that covers two separate categories tracked independently: passenger cars (sedans, SUVs, hatchbacks, and minivans built to carry people) and commercial vehicles (pickup trucks, delivery vans, buses, and heavy trucks built to carry cargo or many passengers). In 2024, passenger cars made up about 73% of the 92.5-million global total. A country that builds a lot of pickups and vans — the U.S., for example — can rank differently on a “passenger cars only” list than it does on the combined total used above.
Which Automaker Actually Builds the Most Cars? (Toyota vs. Volkswagen vs. BYD)
China builds the most cars by country, but no single Chinese automaker tops the company-level rankings yet. Toyota Group has been the world’s best-selling automaker by units since 2020, moving about 10.8 million vehicles in 2024 — ahead of Volkswagen Group and Hyundai-Kia. Find out how many manufacturers actually compete for that spot in our guide to how many car manufacturers there are.
China’s BYD is closing the gap fast — it became the world’s best-selling EV maker and pushed into the global top 10 by total volume in the mid-2020s. Country totals and automaker totals answer two different questions: where a vehicle is physically assembled versus which company designed and branded it. A Toyota built in a Kentucky plant, for example, counts toward U.S. production but Toyota’s company-wide sales total.
How Many Electric Cars Are Made Each Year?
Exact global EV production figures are harder to pin down than sales figures, since not every country publishes a production/sales split — but sales data from the International Energy Agency (IEA) is the closest public proxy. Electric vehicles reached about 25% of global passenger car sales in 2025, up from roughly 21% in 2024. China alone accounted for an estimated 62% of worldwide EV sales that year, with a domestic market share above 50%. Europe’s EV share reached about 27% of new car sales, while the U.S. lagged at roughly 9%.
📊 EVs made up about 25% of global passenger car sales in 2025, up from ~21% in 2024. Source: IEA, Global EV Outlook 2026.
Curious how one specific automaker’s electric output compares? See how many cars Tesla makes a year for a single-brand breakdown.
Why Global Car Production Numbers Change Every Year
Consumer Demand and the Economy
Automakers build to forecasted demand, not a fixed quota. When incomes rise and financing is cheap, factories add shifts and production climbs. When interest rates rise or a recession hits, automakers cut shifts and idle plants within months — which is exactly what drove the 2009 and 2020 dips in the table above.
Automation and Factory Technology
Modern plants lean heavily on robotic welding, painting, and quality-control scanning, which lets a single factory build more vehicles per shift with fewer defects than a comparable plant did in the 1990s. That efficiency gain is part of why global output nearly doubled between 1999 (~47.6 million) and the 2017 peak (~97 million) despite the world adding relatively few brand-new assembly plants in that window.
Supply Chains and Labor
A single missing part can idle an entire assembly line. The clearest recent example: the global semiconductor chip shortage forced automakers to cut an estimated 10.5 million vehicles from planned 2021 production alone, with a further 4.4 million lost in 2022 — around 12 million vehicles in total, according to AutoForecast Solutions. Labor shortages compound the problem, since training a new line worker to full speed typically takes weeks, not days.
Emissions Rules and Environmental Policy
Government emissions targets — the EU’s CO2 fleet targets, U.S. EPA/CAFE standards, and China’s New Energy Vehicle (NEV) credit mandate — push automakers to shift production toward hybrids and EVs, sometimes faster than consumer demand alone would require. Compliance costs and retooling for new powertrains can also temporarily slow output at plants being converted.
What’s Next for Car Manufacturing?
Industry analysts expect full-year 2025 volumes to land close to 2024’s level, with further softening projected for 2026 in China (down an estimated 1.4%) and South Korea, while Japan is expected to hold roughly flat around 7.9 million units. The bigger shift is under the hood: electrification, software-defined vehicles, and a growing share of exports from Chinese brands (about 26.5% of global output in 2025) are changing which countries and companies set the pace, even as the total global number stays in the same 90–95 million range it has occupied since the mid-2010s.
Frequently Asked Questions
How many cars are made worldwide each year?
In 2024, the world produced about 92.5 million motor vehicles, per OICA — 67.7 million passenger cars and 24.8 million commercial vehicles. That’s down 1.1% from 93.5 million in 2023. Industry analysts expect full-year 2025 volumes to land in a similar 92–93 million range.
How many cars are made in the US each year?
The United States built about 10.56 million motor vehicles in 2024, according to OICA data — the second-highest total in the world after China, though still less than a third of China’s output.
Which country produces the most cars?
China has produced more motor vehicles than any other country every year since 2009. In 2024 it built 31,281,592 vehicles — about 34% of the world’s total and nearly three times as many as the second-place United States.
Which car brand makes the most vehicles?
By units, Toyota Group has been the world’s top-selling automaker since 2020, moving about 10.8 million vehicles in 2024 — more than Volkswagen Group or Hyundai-Kia. That’s a company-level ranking, separate from the country-level rankings above.
How many electric cars are made each year?
Exact EV production figures are rarely published, but EVs reached about 25% of global passenger car sales in 2025 (IEA), up from about 21% in 2024. China accounted for roughly 62% of worldwide EV sales that year.
Are passenger cars and commercial vehicles counted the same way?
No. “Passenger cars” (sedans, SUVs, hatchbacks) and “commercial vehicles” (trucks, vans, buses) are tracked as separate categories. In 2024, passenger cars made up about 73% of the 92.5-million global total.
Is global car production going up or down?
It fluctuates with the economy. Production hit an all-time high of about 97 million vehicles in 2017, fell to roughly 78 million in 2020 during the pandemic, recovered to 93.5 million in 2023, then dipped slightly to 92.5 million in 2024 — a normal year-to-year swing, not a long-term reversal.
Global car production keeps hovering in the 90–95 million range each year, but who builds those vehicles — and how — keeps shifting toward automation, electrification, and Chinese-brand exports. Check back for updates as 2025’s final OICA figures are published.
Products related to this article
Sponsored / affiliate links. As an Amazon Associate I earn from qualifying purchases. I may earn additional commission from eligible campaigns.