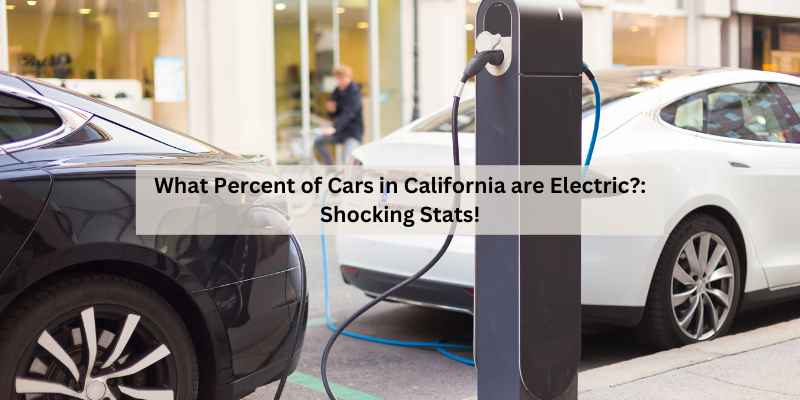
California Electric Car Percentage: The Real Story Behind the Headlines
You’ve seen the headlines: California sets another record for EV sales. But what does that number actually measure? Is it new cars sold last quarter, or every electric car registered in the state? Does it include plug-in hybrids, or only pure battery electrics? And why does the percentage seem to jump around depending on which report you read?
I dug into the quarterly data from the California Energy Commission (CEC) and the California Air Resources Board (CARB) to untangle the mechanics behind the statistic. You’ll walk away knowing how the percentage is calculated, where adoption is strongest and weakest, and what the 2035 ban on new gas car sales really means for the timeline.
If you’re shopping for an EV and need a home charger, the AIMILER Level 2 charger is a solid plug-and-play option with a 25-foot cable and adjustable amperage from 16A to 32A, which covers most home setups. It’s ETL certified, and the Wi-Fi app lets you schedule charging for off-peak rates. We’ll get back to that later.
California’s EV Market Share: The Latest Numbers
For the second quarter of 2026, zero-emission vehicles (ZEVs) — which includes battery electric, plug-in hybrid, and fuel cell vehicles — made up 25.7% of all new cars sold in California. That’s roughly one in four new vehicles. Battery electric vehicles alone accounted for 19.2% of new sales.
Those figures come from the CEC’s quarterly new vehicle market analysis, which pulls data directly from dealer reports. It’s the most reliable source for sales percentages, but it’s not the same as the total number of EVs on the road.
The total light-duty vehicle population in California is around 31 million. EVs make up roughly 7% of that total fleet. So while new sales are booming, the overall transition is still early — most cars on the road are still gasoline-powered.
Breaking Down the Data: BEVs vs. PHEVs vs. Total Fleet
It’s easy to lump all EVs together, but the split between battery electric (BEV) and plug-in hybrid (PHEV) matters.
In Q2 2026, BEVs were 19.2% of new sales. PHEVs added another 6.3%. Fuel cell vehicles barely registered at 0.2%. The remaining ~74% were internal combustion engine vehicles, including traditional hybrids that don’t plug in.
Here’s the thing: PHEVs are a bridge technology. They run on electricity for the first 20-40 miles, then switch to gas. They’re great for reducing emissions in the short term, but they still burn fuel. The state’s long-term goal is to phase them out along with gas cars.
When you look at the total fleet on the road, the BEV share drops significantly. Of the 31 million light-duty vehicles registered in California, only about 1.1 million are pure battery electric. Add in PHEVs and you get to roughly 1.8 million ZEVs. That’s about 5.8% of the registered fleet — a far cry from the 25.7% new sales figure.
The gap between new sales and total fleet is normal. It takes years for new car sales to change the composition of the entire vehicle population. But it explains why you still see mostly gas cars on the highway even though EV sales are setting records.
Why the Percentage Varies: Sales Data vs. Registration Data
You’ll see different percentages depending on whether you’re looking at sales or registrations. Both are valid, but they answer different questions.
Sales data counts new vehicles sold in a given quarter. It’s forward-looking and shows the current trajectory. The CEC and CARB both publish this quarterly.
Registration data counts all vehicles currently registered in the state, regardless of when they were sold. It’s a lagging indicator that shows the actual composition of the fleet. The California Department of Motor Vehicles (DMV) publishes this annually.
The discrepancy can be large. In 2026, new EV sales hit 25% for the year. But EV registrations only reached about 7% of the total fleet. Neither number is wrong — they’re just measuring different things.
Pro tip: When someone quotes a percentage, ask whether it’s sales or registrations. It changes the conversation completely.
| Metric | Source | Frequency | Q2 2026 Figure |
|---|---|---|---|
| New ZEV Sales Share | CEC Quarterly Report | Quarterly | 25.7% |
| New BEV Sales Share | CEC Quarterly Report | Quarterly | 19.2% |
| New PHEV Sales Share | CEC Quarterly Report | Quarterly | 6.3% |
| ZEV Share of Total Fleet | DMV Registration Data | Annual | ~5.8% |
| BEV Share of Total Fleet | DMV Registration Data | Annual | ~3.5% |
That table shows why the headline number can be misleading. A 25.7% new sales share is impressive, but it doesn’t mean a quarter of all cars in California are electric.
Regional Divide: Where EV Adoption is Highest and Lowest
EV adoption isn’t uniform across the state. The Bay Area leads by a wide margin, followed by the Central Coast and parts of Southern California.
In Santa Clara County, ZEVs made up over 35% of new car sales in 2026. San Francisco and San Mateo counties were close behind. The pattern makes sense: higher incomes, more charging infrastructure, and a tech-savvy population.
The Central Valley tells a different story. In Fresno County, ZEVs were just 12% of new sales. Kern County was even lower at around 10%. These areas have fewer public chargers, lower median incomes, and longer commutes — all factors that suppress adoption.
The state’s equity programs are trying to close this gap. CARB’s Clean Cars 4 All program offers up to $9,500 in incentives for low-income residents to replace old gas cars with EVs. But the infrastructure gap remains a major barrier. If you live in a rural area without reliable home charging, an EV is a hard sell.
Key Drivers Behind the Record-Breaking Quarter
Several forces converged to push Q2 2026 to a record high.
First, model availability has exploded. In 2026, California buyers had maybe 20 EV models to choose from. By 2026, that number was over 50. The Chevrolet Equinox EV, Ford F-150 Lightning, and Hyundai Ioniq 5 are all competing in segments that had no EV options just a few years ago.
Second, price parity is getting closer. The average transaction price for an EV in California was about $55,000 in mid-2026, down from over $65,000 in 2026. Federal tax credits of up to $7,500, now transferable to the dealer at the point of sale, reduced the upfront cost further.
Third, the used EV market is finally taking off. Thousands of off-lease EVs are hitting the market at prices between $15,000 and $25,000. That’s bringing electric cars into reach for buyers who couldn’t afford a new one.
Fourth, range anxiety is fading. The average new EV now has a range of over 250 miles, and the state has over 100,000 public chargers. It’s not perfect — rural areas are still under-served — but the infrastructure is no longer the deal-breaker it was in 2026.
The Hidden Influence of Fleet Sales on the Overall Percentage
Here’s a wrinkle most articles miss: fleet sales inflate the headline percentage.
Fleet sales include vehicles bought by rental car companies, rideshare operators like Uber and Lyft, and government agencies. These are not retail purchases by individuals.
In Q2 2026, fleet sales accounted for roughly 14% of all new ZEV registrations in California. Rental companies like Hertz and Avis have been buying EVs in bulk to meet corporate sustainability goals. Rideshare drivers, incentivized by CARB’s Clean Miles Standard, are switching to EVs at a rapid clip.
That’s not a bad thing — it gets more EVs on the road. But it means the retail consumer share is slightly lower than the headline suggests. If you strip out fleet sales, the retail ZEV share was around 22% in Q2 2026.
The distinction matters for forecasting. Fleet vehicles are replaced on a 3-5 year cycle, which means they’ll flood the used market soon. That’s actually good news for affordability.
How California’s Share Compares to the Rest of the U.S.
California is the undisputed leader in U.S. EV adoption, but the gap is narrowing.
Nationwide, EVs were about 8% of new car sales in Q2 2026. California’s 25.7% is more than three times the national average. The state accounts for roughly 40% of all EVs sold in the U.S., despite having only 12% of the population.
Other states are catching up. Washington, Oregon, and Colorado all have EV shares above 15%. New Jersey and Massachusetts are close behind. But no state comes close to California’s raw volume.
China and Norway are the global leaders. Norway hit an 82% EV share in 2026, thanks to aggressive tax exemptions and a tiny population. China sells more EVs in a month than California sells in a year, but EV share is still only around 30% there.
California’s advantage comes down to policy: the ZEV mandate, generous incentives, and a regulatory framework that penalizes automakers who don’t sell enough clean vehicles.
The Road to 100%: Projections, Barriers, and the 2035 Ban
California’s Advanced Clean Cars II rule requires all new light-duty vehicle sales to be zero-emission by 2035. That’s the law, but the path to 100% is anything but smooth.
If current growth rates hold — roughly 2-3 percentage points per year — the state would hit 50% new EV sales by 2030 and 100% by 2035. But that assumes linear growth, which is rare in any market.
Several roadblocks could slow things down.
Grid capacity is the big one. The California Independent System Operator (CAISO) has warned that peak demand could outpace supply on hot summer evenings, especially as EV charging ramps up. Time-of-use rates help shift charging to off-peak hours, but not everyone can charge overnight.
Charging infrastructure is still uneven. The state has a goal of 250,000 public chargers by 2026, but it’s only about halfway there. Multifamily housing is a particular problem — renters often have no access to Level 2 chargers at home.
Price parity for the mass market is still a few years away. The average EV costs about $10,000 more than the average gas car. Without the federal tax credit, which is capped by income limits and assembly location, many buyers can’t make the math work.
The used EV market will help. As more EVs come off lease, prices will drop. But that process takes time, and it doesn’t solve the grid or charging issues.
The 2035 ban is a mandate, not a prediction. It tells automakers what they can sell, but it doesn’t force consumers to buy. If the infrastructure and grid aren’t ready, the state could face pushback or extend the timeline.
What This Means for Your Next Car Purchase
If you’re in the market for a car in California, the data points to a few practical takeaways.
First, don’t wait for the perfect EV. The technology is good enough now for most commutes. Range is no longer a serious limitation for daily use.
Second, check your home charging situation before you buy. A Level 2 charger installation costs between $500 and $2,000, depending on your electrical panel. The AIMILER charger I mentioned earlier plugs into a NEMA 14-50 outlet, which most electricians can install for a few hundred dollars. It’s a portable unit, so you can take it with you if you move.
Third, factor in the incentives. California’s Clean Vehicle Rebate Project is gone, but the federal tax credit transfer at the dealership is the best deal right now. You get the discount upfront instead of waiting for tax season.
Fourth, consider a used EV. Prices have dropped significantly, and many come with a remaining portion of the original 8-year battery warranty. A used Bolt or Leaf can be had for under $15,000.
Finally, understand the charging math. Level 2 charging adds about 25 miles of range per hour. That means an overnight charge covers most daily driving needs. Public fast charging is for road trips, not daily use — it’s too expensive and puts extra wear on the battery.
Data Sources and How to Track Changes
The numbers in this article come from public sources you can check yourself.
The California Energy Commission publishes quarterly new vehicle market data, broken down by fuel type and county. That’s the best source for sales percentages.
The California DMV publishes annual registration statistics. That’s where you’ll find the total fleet composition.
CARB publishes the ZEV mandate compliance data, which shows how each automaker is performing against its sales targets.
For national comparisons, the U.S. Department of Energy’s Alternative Fuels Data Center tracks EV sales and charging infrastructure across all 50 states.
If you want a quick weekly pulse, the California electric car percentage page on this site updates with the latest figures as they’re released.
What is the current California electric car percentage for new sales?
As of Q2 2026, ZEVs (battery electric, plug-in hybrid, and fuel cell) made up 25.7% of new car sales in California. Battery electric vehicles alone were 19.2%.
Why is the California electric car percentage different from the national average?
California’s ZEV mandate, stricter emissions standards, and substantial charging infrastructure create a more favorable environment for EV adoption. The state also has a higher concentration of early adopters and a larger pool of incentives. The national average was about 8% in Q2 2026.
Does the California electric car percentage include plug-in hybrids?
Yes, the official ZEV percentage includes PHEVs. However, the CEC also reports battery electric and plug-in hybrid shares separately. In Q2 2026, BEVs were 19.2% and PHEVs were 6.3% of new sales.
How does the state calculate the percentage?
The CEC uses dealer-reported new vehicle registrations. That means it counts vehicles sold and registered in California during the quarter, not just sold. This is slightly different from the national data, which often uses sales estimates from automotive research firms.
Will the California electric car percentage reach 100% by 2035?
The ZEV mandate requires it, but there are significant hurdles. Grid capacity, charging infrastructure in rural areas, and the cost of entry-level EVs are the main barriers. If those issues are not resolved, the state may struggle to meet the deadline, although the mandate itself is unlikely to be repealed.
What to Do With This Information
- Read the fine print: Always check whether a percentage refers to new sales or total registered fleet. They tell different stories.
- Look at county-level data: Statewide averages hide massive regional differences. Your local adoption rate matters more than the state figure.
- Factor in fleet sales: Rental and rideshare purchases inflate the headline. Retail consumer share is a few points lower.
- Check your home charging setup early: A Level 2 charger is essential for daily EV ownership. The AIMILER charger is a good portable option that works with a standard NEMA 14-50 outlet.
- Don’t wait for the 2035 deadline: The used EV market is already affordable, and new prices are dropping. Waiting won’t save you money.
- Track the quarterly CEC reports: The numbers change every three months. What’s true today may not be true next quarter.
Products related to this article
Sponsored / affiliate links. As an Amazon Associate I earn from qualifying purchases. I may earn additional commission from eligible campaigns.
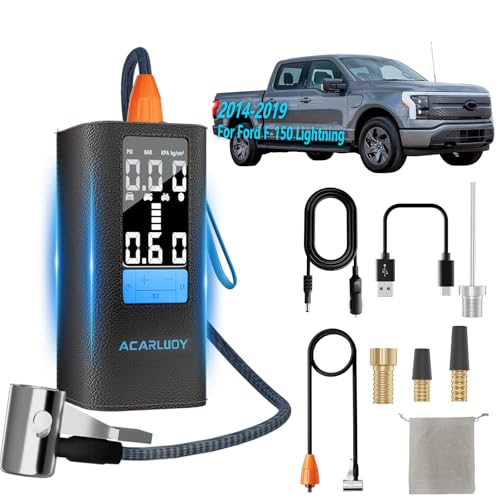 ACARLUOY Portable Air Compressor for Car Tires - 3X Faster Inflation, Fit for Ford F-150 Lightning 2014-2019,6000mAh Battery, LCD Screen, LED Light,Auto Shutoff
 ACARLUOY Portable Air Compressor for Car Tires - 3X Faster Inflation, Fit for Ford F-150 Lightning Ford 2014-2019,6000mAh Battery, LCD Screen, LED Light,Auto Shutoff