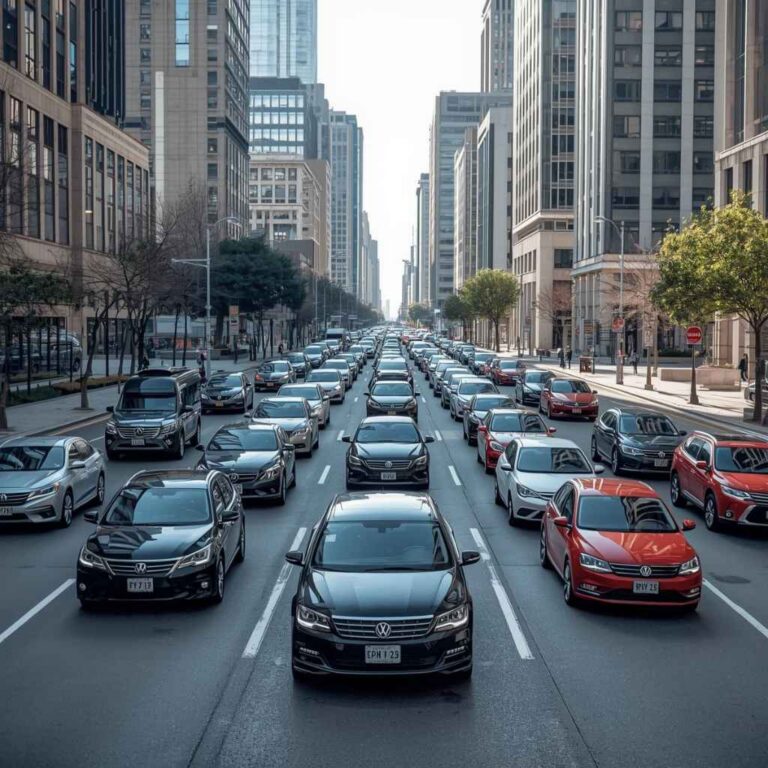

How Many People Drive Cars? 239.8M US Licensed Drivers (2024)
The United States had 239,824,944 licensed drivers in 2024, which is 84.6% of residents of all ages, according to the Federal Highway Administration (FHWA). No official source read for this update gives a worldwide count of drivers, so global figures online are estimates. This guide separates licensed drivers, people who drive and vehicles, and gives the year and source for every number.
Global Car Ownership and Driver Numbers
There is no single official number for how many people drive cars in the world. Licensing rules, record keeping and the way a "driver" is counted differ by country, and the FHWA, Census Bureau and World Health Organization pages read for this update publish no global driver total. The one global vehicle figure in them comes from the WHO’s road traffic injuries fact sheet (dated 20 July 2026): low- and middle-income countries have around 60% of the world’s vehicles. The fact sheet does not state a year for that share. See the WHO fact sheet.
For counts of cars rather than drivers, our how many cars are in the world page compares the published sources. What follows uses only official US data, where the definitions are documented.
Pick for Paper Road-Trip Planning
 |
Rand McNally 2027 Road Atlas ($24.99 on Amazon when checked 2026-10-14) Best for: Drivers who want a printed road atlas for trip planning. The cover shows United States, Canada and Mexico. Why we picked it: It is a current-edition road atlas, and the listing shows it in stock. The numbers on this page are about who drives; an atlas is for where you drive. Main drawback: The listing data we pulled gave only the title, cover and price, so check the Amazon page for page count and map scale before you buy. |
As an Amazon Associate we earn from qualifying purchases. Spec-based pick from the listing, not a hands-on test.

Licensed Drivers, People Who Drive and Vehicles: What Each Number Counts
Three different things get called "how many people drive". They are not interchangeable, and mixing them is the main reason published figures disagree.
| Term | What it counts | Latest figure used here | Source |
|---|---|---|---|
| Licensed drivers | Driver license records in a state, including restricted and graduated licenses (FHWA footnote to Table DL-1C) | 239,824,944 in the US, 2024 | FHWA Table DL-20 |
| People who drive | Anyone who actually drives, licensed or not, daily or rarely. The pages read give no national headcount; the closest official measure is how workers get to work | 69.2% of workers drove alone to work, 2024 | Census Bureau, ACS 1-year |
| Registered vehicles | Motor vehicles registered with states: automobiles, buses, trucks and motorcycles, private and publicly owned | 297,525,836 in the US, 2024 | FHWA Table MV-1 |
| Vehicle-miles traveled | Miles driven by all motor vehicles, an FHWA estimate | 3,294,031 million miles in the US, 2024 | FHWA Table VM-1 |
How Many People Drive Cars in the US? The Numbers by Source
This table lists each measure with its year, geography and source. All US figures are for 2024 unless the row says otherwise, and they describe that report year, not today.
| Measure | Value | Year | Geography | Source |
|---|---|---|---|---|
| Licensed drivers | 239,824,944 | 2024 | United States | FHWA DL-20 |
| Licensed drivers as percent of population, all ages | 84.6% | 2024 | United States | FHWA DL-20 |
| Licensed drivers per 1,000 residents | 707 | 2024 | United States | FHWA DL-1C |
| Licensed drivers per 1,000 people aged 16 and over | 872 | 2024 | United States | FHWA DL-1C |
| Licensed drivers per private and commercial registered vehicle | 0.82 | 2024 | United States | FHWA DL-1C |
| All registered motor vehicles | 297,525,836 | 2024 | United States | FHWA MV-1 |
| Registered light-duty vehicles | 271,085,742 | 2024 | United States | FHWA VM-1 |
| Workers who drove alone to work | 69.2% | 2024 | United States | Census ACS 1-year |
| Workers who worked from home | 13.3% | 2024 | United States | Census ACS 1-year |
| Share of world vehicles in low- and middle-income countries | around 60% | Not stated | World | WHO fact sheet |
FHWA’s population base for these ratios is 339,058,370 residents, of whom 274,996,535 are 16 or older. Our own arithmetic on the same tables: 297,525,836 registered motor vehicles is about 1.24 vehicles per licensed driver, but that count includes buses, motorcycles and publicly owned vehicles, so it does not mean the average driver owns 1.24 cars. If you want the car-count side, see how many cars are in the US.
Growth has been steady. FHWA’s DL-220 table counts 93,573 thousand licensed drivers in 1963 and 239,825 thousand in 2024, about 2.6 times as many by our arithmetic.
| Year | Licensed drivers (thousands) |
|---|---|
| 1963 | 93,573 |
| 1980 | 145,295 |
| 2000 | 190,624 |
| 2010 | 210,114 |
| 2020 | 228,196 |
| 2024 | 239,825 |

Demographics Of Drivers
FHWA Table DL-20 splits the 2024 count by age and sex relative to Census population estimates. Licensing climbs quickly after 16 and then stays above 89% from the late 20s through the 60s.
| Age group | Licensed drivers | Percent of age-group population |
|---|---|---|
| 16 | 1,189,261 | 26.2% |
| 17 | 2,015,370 | 44.4% |
| 18 | 2,694,602 | 60.4% |
| 19 | 3,033,979 | 68.8% |
| 20-24 | 17,881,504 | 80.9% |
| 25-29 | 19,831,612 | 89.3% |
| 40-44 | 20,375,375 | 91.4% |
| 60-64 | 19,675,632 | 92.4% |
| 75-79 | 10,875,551 | 90.7% |
| 80-84 | 6,391,081 | 87.5% |
| 85 and over | 4,580,986 | 71.2% |
| All ages | 239,824,944 | 84.6% |
By sex, FHWA counts 118,750,405 male and 121,004,560 female licensed drivers, equal to 85.3% of men and 83.7% of women. Female drivers outnumber male drivers overall, but women hold licenses at lower rates at the oldest ages: among those 85 and over, 86.9% of men hold licenses against 61.7% of women. The table notes that totals include drivers of unknown sex.
The youngest ages deserve a caution. DL-220 shows 1,470 thousand 16-year-old licensed drivers in 2000 and 1,189 thousand in 2024, but those are counts, not rates, and FHWA’s footnote says reporting rules for the youngest drivers changed over the years (graduated licenses were added from 2006 and learner permits excluded from 2012). The data alone do not prove that fewer teens drive.
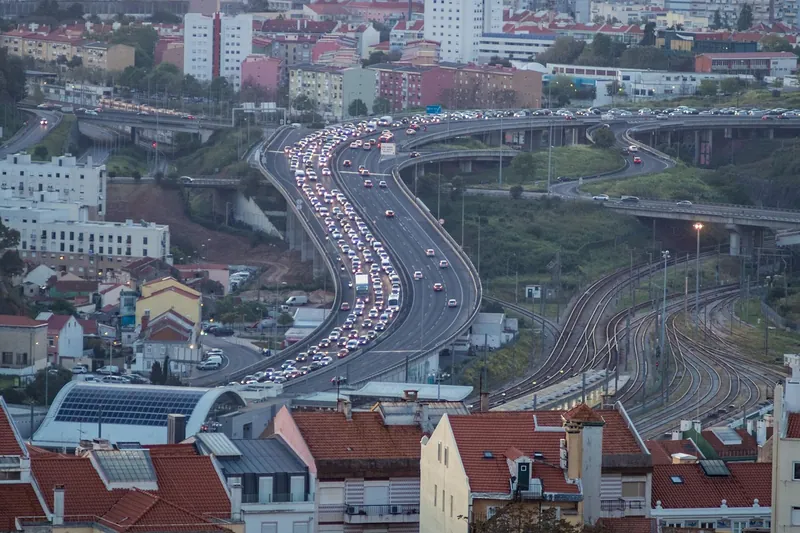
Drivers vs. Cars: Why the Numbers Aren’t the Same
FHWA Table MV-1 counted 297,525,836 registered motor vehicles in 2024. Per the table’s own columns, that is 97,413,321 automobiles, 189,754,931 trucks, 1,096,335 buses and 9,261,249 motorcycles, private and publicly owned together. Against 239,824,944 licensed drivers the totals look close, but they measure different things: a household can register several vehicles for one driver, fleets and public agencies register vehicles with no individual owner, and many licensed people own no vehicle.
| Vehicle type (MV-1, 2024) | Registered |
|---|---|
| Automobiles | 97,413,321 |
| Trucks | 189,754,931 |
| Buses | 1,096,335 |
| Motorcycles | 9,261,249 |
| All motor vehicles | 297,525,836 |
Table DL-1C divides licensed drivers by private and commercial registered vehicles only and gets 0.82 for the nation. State values range widely because states report registrations differently: Delaware shows 2.07 and Montana 0.36. FHWA does not explain those outliers in the table, so treat state ratios as a data-quality flag, not a measure of how many people drive. The same caution applies to the per-1,000 figures below.
| State (DL-1C, 2024) | Licensed drivers per 1,000 people aged 16+ |
|---|---|
| Arkansas | 1,202 |
| Delaware | 1,054 |
| South Dakota | 959 |
| California | 871 |
| Texas | 800 |
| New York | 761 |
| Kentucky | 756 |
| Kansas | 745 |
| District of Columbia | 726 |
| United States | 872 |
A value above 1,000 means the state reports more licenses than residents of driving age. FHWA’s table does not say why, so we do not guess.
Urban Vs. Rural Driving
FHWA’s VM-1 table estimates 3,294,031 million vehicle-miles for all motor vehicles in 2024: 2,269,186 million on urban roads (68.9% by our arithmetic) and 1,024,845 million on rural roads (31.1%). The average registered motor vehicle traveled 11,071 miles that year, and the average light-duty vehicle 10,787 miles. Dividing all vehicle-miles by licensed drivers gives roughly 13,700 miles per driver, but that is our own rough ratio and it includes trucks and buses, so do not read it as how far a typical person drives.
How Many People Drive to Work?
The Census Bureau’s American Community Survey is the main official source on commuting. Its 2024 1-year estimates, summarized on the Census commuting at a glance page, show that 69.2% of workers drove alone to work, no different from 69.2% in 2023. Public transportation carried 3.7% of workers (3.5% in 2023), and 13.3% worked from home (13.8% in 2023). Mean one-way travel time was 27.2 minutes, up from 26.8, and 9.3% of workers traveled 60 minutes or more. These are shares of workers, so they say nothing about retirees, students or weekend driving. For a related global angle, see what percentage of the world drives.
Myths About How Many People Drive
| Myth | What the official data show |
|---|---|
| Everyone drives | FHWA DL-20 shows 84.6% of US residents of all ages hold a license; at age 16 it is 26.2%, and at 85 and over 71.2% (2024). |
| 1.6 billion people drive worldwide | This figure circulates online, but none of the official pages read for this update publish it, so this page no longer uses it. |
| More vehicles than drivers means every driver owns a car | 297,525,836 registered vehicles include 1,096,335 buses and 189,754,931 trucks, some publicly owned; DL-1C puts licensed drivers at 0.82 per private or commercial vehicle. |
| Young people no longer drive | 80.9% of 20-24 year olds held licenses in 2024. 16-year-old license counts fell from 1,470 thousand (2000) to 1,189 thousand (2024), but counts are not rates. |
| Most commuters carpool | 69.2% of workers drove alone to work in 2024 (ACS). |
Frequently Asked Questions
How many people drive cars daily?
No official source read for this update counts daily drivers. The closest official measure is the Census Bureau’s 2024 ACS estimate that 69.2% of workers drove alone to work. FHWA also estimates 3,294,031 million vehicle-miles traveled in 2024, which measures miles, not people.
What percentage of people drive cars?
In the US, FHWA reports 239,824,944 licensed drivers in 2024, equal to 84.6% of residents of all ages and 87.2% of people aged 16 and over (872 per 1,000). Licensed is not the same as drives regularly. The official pages read give no worldwide percentage.
How many licensed drivers are there worldwide?
No worldwide total appears in the FHWA, Census or WHO pages read for this update, so we do not state one. The US figure is 239,824,944 licensed drivers in 2024 (FHWA Table DL-20). Treat any single global number you see online as an unsourced estimate unless it names its method.
How many cars are on the road worldwide?
The WHO fact sheet says low- and middle-income countries have around 60% of the world’s vehicles but gives no worldwide total. For the US, FHWA Table MV-1 counted 297,525,836 registered motor vehicles in 2024, including 97,413,321 automobiles.
Why is it hard to get an exact global driver count?
Definitions and record keeping differ. FHWA itself notes that its under-16 driver counts changed with state reporting rules, and the state ratios in Table DL-1C range from 0.36 to 2.07 licensed drivers per vehicle. Across countries those inconsistencies grow, so a precise global total is not published in the sources read.
How many licensed drivers are there in the US?
FHWA Table DL-20 counts 239,824,944 licensed drivers in 2024: 118,750,405 men and 121,004,560 women, with drivers of unknown sex included in the total. The count covers restricted and graduated licenses and describes 2024, not today.
Conclusion
The best-supported answer is a US one: 239,824,944 licensed drivers in 2024, about 87 in every 100 people of driving age, alongside 297,525,836 registered vehicles and 3.29 trillion vehicle-miles. Anything bigger than that, especially a worldwide driver count, needs a source that states its definition and year. Check the FHWA licensed drivers table DL-20 for the next update, and see how many people own cars in the US for the ownership side.
Products related to this article
Sponsored / affiliate links. As an Amazon Associate I earn from qualifying purchases. I may earn additional commission from eligible campaigns.